Freight Spend Analytics
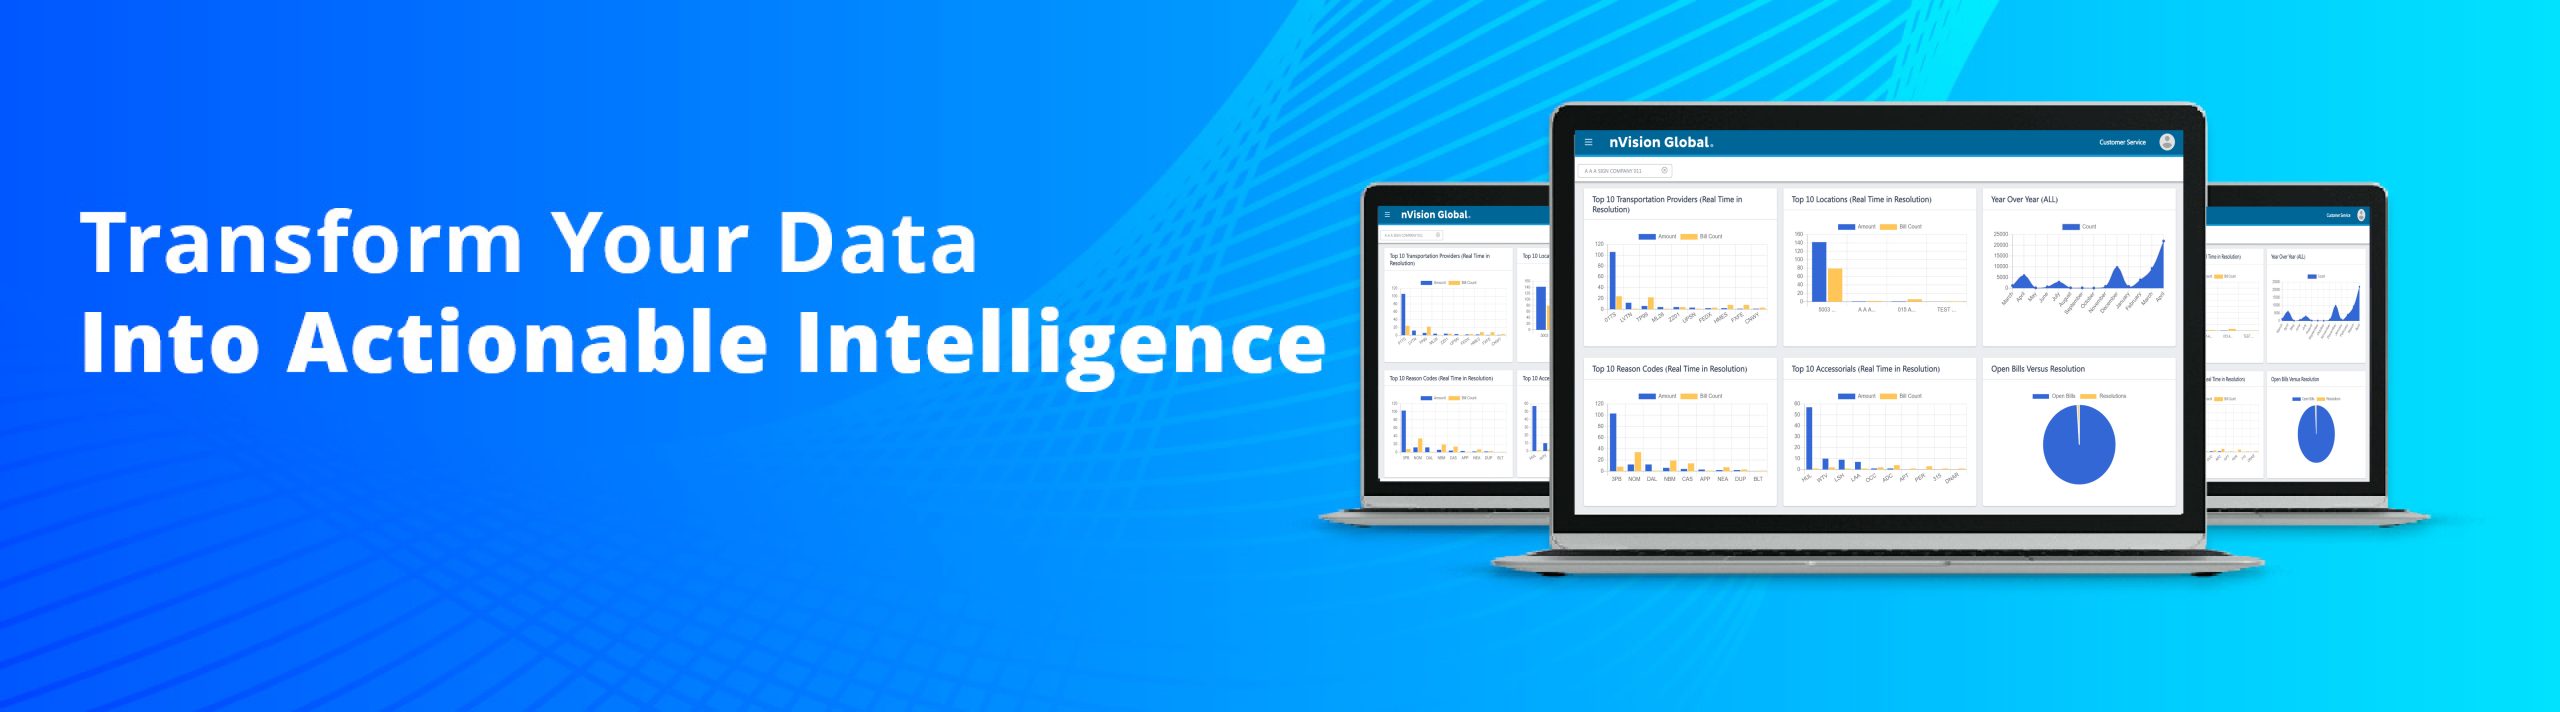
Business Intelligence (BI) leverages software and services to transform data into actionable intelligence that informs an organization’s strategic and tactical business decisions. BI tools access and analyze data sets and present analytical findings in reports, summaries, dashboards, graphs, charts and maps to provide users with detailed intelligence about the state of the business. — CIO Magazine, September 1, 2017
")
")
nVision Global’s customers understand the value of the extensive data we capture from each and every invoice. They also understand the normalization and enrichment processes that we offer make this data actionable. No longer are they trying to compare one provider’s accessorial description to another provider’s description to match them up. We normalize and enrich all of these charges so that when you use our extensive reporting platform, you have the data you need to make decisions that ultimately save you money.
Our platform has in excess of 1000 standard KPIs, mapping capabilities, multiple report formats along with several export options that ensure you gain unparalleled visibility, increased efficiency, improved cost control, and year-over-year savings that no other solution on the market offers.
Users are able to customize the data they see on their screen and in their reports. You can choose the data elements, the format of delivery, how you want to analyze the data (mapping, spreadsheet, interactive widget, etc.), and we allow for the saving and automation of delivery to one or many recipients. We provide enormous quantities of data that are normalized and presented through graphs, charts and tables to make it more consumable for any user.